파이썬 캔들 차트, plotly-03 #Candlestick Parameters 살펴보기2-hoverinfo Programming/Python2021. 2. 24. 13:35
이전글에서는 decreasing 에 대해서 알아보았구요.
이번에는 순서상 중요한 것이 hoverinfo 가 있겠네요. 한번 알아보도록 하겠습니다.
[링크]
https://plotly.com/python-api-reference/generated/plotly.graph_objects.layout.template.data.html
property high
Sets the high values.
The ‘high’ property is an array that may be specified as a tuple, list, numpy array, or pandas Series
Returns
Return type
numpy.ndarray
# high는 고가, 기본적인 데이터라고 보면 됩니다. 이거와 기본적으로 들어가는 것들이 open(시가), close(종가), low(저가)
property highsrc
Sets the source reference on Chart Studio Cloud for high .
The ‘highsrc’ property must be specified as a string or as a plotly.grid_objs.Column object
Returns
Return type
# 이 파라미터 또한 chart studio 에서 쓰는 옵션 인 것 같네요.
property hoverinfo
Determines which trace information appear on hover. If none or skip are set, no information is displayed upon hovering. But, if none is set, click and hover events are still fired.
The ‘hoverinfo’ property is a flaglist and may be specified as a string containing:
- Any combination of [‘x’, ‘y’, ‘z’, ‘text’, ‘name’] joined with ‘+’ characters (e.g. ‘x+y’) OR exactly one of [‘all’, ‘none’, ‘skip’] (e.g. ‘skip’)
- A list or array of the above
Returns
Return type
Any|numpy.ndarray
# 이 옵션은 차트를 그려놓은 상태에서 캔들에 마우스를 올리게 되면 띄워지는 옵션이라고 보면됩니다.
# 기본적인 셋팅은 아래와 같습니다.
# 마우수를 가져가면 캔들 위로 x 축 레이블, open, close, high, low 값이 뜨게 됩니다.
import plotly.graph_objects as go

fig = go.Figure(data=[go.Candlestick(x=[1, 2, 3, 4, 5],
                open  = [ 1, 6, 7, 10, 5 ],
                close = [ 2, 10, 3, 12, 8  ],
                high  = [ 10, 12, 8, 15, 18 ],
                low   = [ 0.1, 5, 2, 8, 5 ],
                )])

fig.show()
# 설명에 있는 대로 옵션을 조금씩 바꿔 보도록 하겠습니다.
hoverinfo = 'x'
hoverinfo = 'y'
hoverinfo = 'z'# z 값은 3차원 그래프에서 적용되는 듯 한데요. 적용을 해도 아무 표시도 뜨지 않네요.
hoverinfo = 'text'# 이 옵션은 text 값을 별도로 넣어주어야 합니다.
import plotly.graph_objects as go

fig = go.Figure(data=[go.Candlestick(x=[1, 2, 3, 4, 5],
                open  = [ 1, 6, 7, 10, 5 ],
                close = [ 2, 10, 3, 12, 8  ],
                high  = [ 10, 12, 8, 15, 18 ],
                low   = [ 0.1, 5, 2, 8, 5 ],
                text = '캔들차트',
                hoverinfo = 'text'
                )])

fig.show()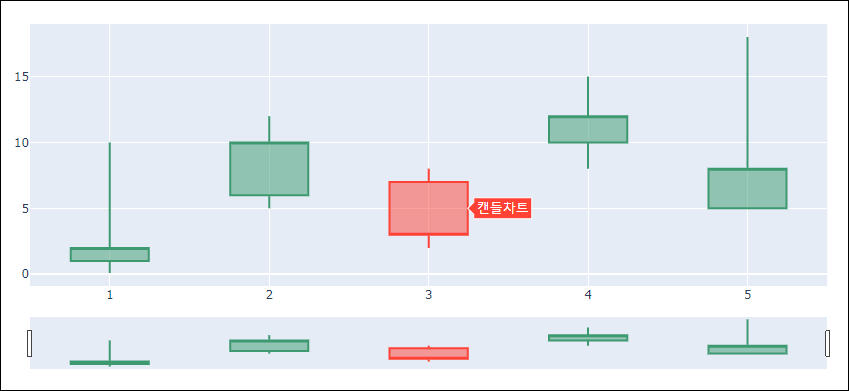
# 여기서 text 파라미터에 대해서 함께 살펴보면 text 에는 list 형태로도 올수 있다고 합니다.
# 리스트에 각각의 값을 넣어주면 캔들마다 표시가 됩니다. 다시 말해 위와 같이 text='캔들차트' 하나만 넣게 되면 모든 캔들에 '캔들차트'라고 뜨지만 아래와 같이 리스트로 정해주면 정해준 숫자만큼 앞에서 부터 지정이 됩니다.
# 뒤쪽에 지정안된 캔들은 표시가 안됨.
property text
Sets hover text elements associated with each sample point. If a single string, the same string appears over all the data points. If an array of string, the items are mapped in order to this trace’s sample points.
The ‘text’ property is a string and must be specified as:
- A string
- A number that will be converted to a string
- A tuple, list, or one-dimensional numpy array of the above
Returns
Return type
str|numpy.ndarray
text = ['캔들1', '캔들2']
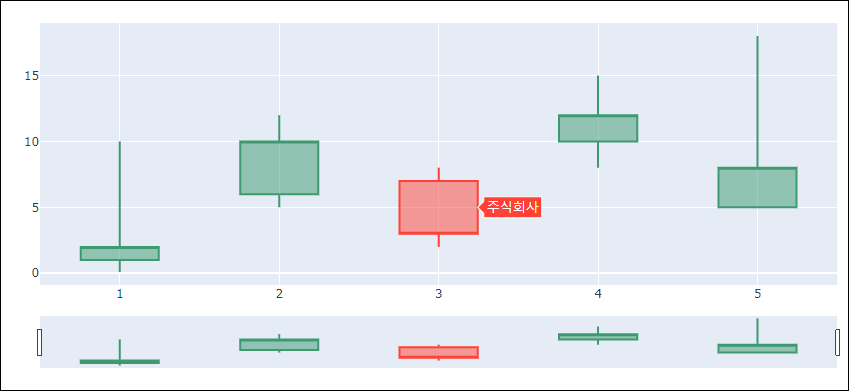
# name 옵션은 범례를 표시한다고 생각하시면 됩니다. 이것 또한 모든 캔들위에 저것만 표시가 됩니다.
name = '주식회사',
hoverinfo = 'name'
property name
Sets the trace name. The trace name appear as the legend item and on hover.
The ‘name’ property is a string and must be specified as:
- A string
- A number that will be converted to a string
Returns
Return type
# 조합을 통해서도 나타낼 수 있습니다.
hoverinfo = 'x+y'# 초기 셋팅이랑 동일합니다.
# 하나만 더 해보자면
text = ['캔들1', '캔들2', '캔들3', '캔들4', '캔들5'],
hoverinfo = 'x+text'
# 이런식으로도 조합이 가능합니다.
# x+y, y+text, x+name 등등 필요 용도에 따라 조합해서 사용하시면 될듯합니다.
# 그리고 all, none, skip 이 있습니다. none과 skip 은 어떠한 정보도 표시하지 않습니다.
# all은 아래와 같이 모든 정보가 표시됩니다.
name = '주식회사',
text = ['캔들1', '캔들2', '캔들3', '캔들4', '캔들5'],
hoverinfo = 'all'
# 이렇게 하나씩 살펴보니 참 다양한 옵션들이 있네요. 정작 주식을 잘하기 위해서 이게 무슨 쓸모가 있을지는 모르겠지만..^^;; 오늘도 이렇게 하나씩 공부를 해나간다는 생각으로 앞으로 나아가겠습니다.
[이전글]
2021/02/17 - [Programming/Python] - plotly-01 #Candlestick Charts 살펴보기
2021/02/19 - [Programming/Python] - plotly-02 #Candlestick Parameters 살펴보기1-decreasing
'Programming > Python' 카테고리의 다른 글
| Range 함수 역순 (0) | 2021.06.10 |
|---|---|
| tensorflow 깔아보기 (0) | 2021.05.08 |
| 파이썬 캔들 차트, plotly-02 #Candlestick Parameters 살펴보기1-decreasing (0) | 2021.02.19 |
| 파이썬 캔들 차트, plotly-01 #Candlestick Charts 살펴보기 (0) | 2021.02.17 |
| 파이썬 차트, plotly-00 #시작 (0) | 2021.02.16 |