[패스트캠퍼스 수강 후기] 데이터전처리 100% 환급 챌린지 10회차 미션 Programming/Python2020. 11. 11. 10:47
[파이썬을 활용한 데이터 전처리 Level UP- 10 회차 미션 시작]
* 복습
- pie chart, box plot 및 실제 주문서 를 정리하는 내용으로 실제 프로젝트를 가지고 강의를 했었다. box plot 의 경우에도 그 효용에 대해서 간략히 설명을 했어고, 실제 프로젝트에서 엑셀의 요소를 읽어와서 하는 부분이 괜찮았다.
[01. Part 1) 데이터 핸들링 Chapter 07. 직접 해보기 - 02. 뉴스 기사 요약하여 정리하기]


* 문제상황
// 특수문자도 많이 있지만, 별도로 미리 작성을 해놨다. 원래는 깔끔하지 않는 기사이다.

* 월별 뉴스 기사 수 추이 시각화
// 하나의 요소에 대해서는 bar graph 도 나쁘지 않다. Line 도 나쁘지 않다.

* 주요 단어 추출 및 시각화
// 주용한 단어 위주의 순위를 두어서 출력하고, 나머지는 기타로 둔다.

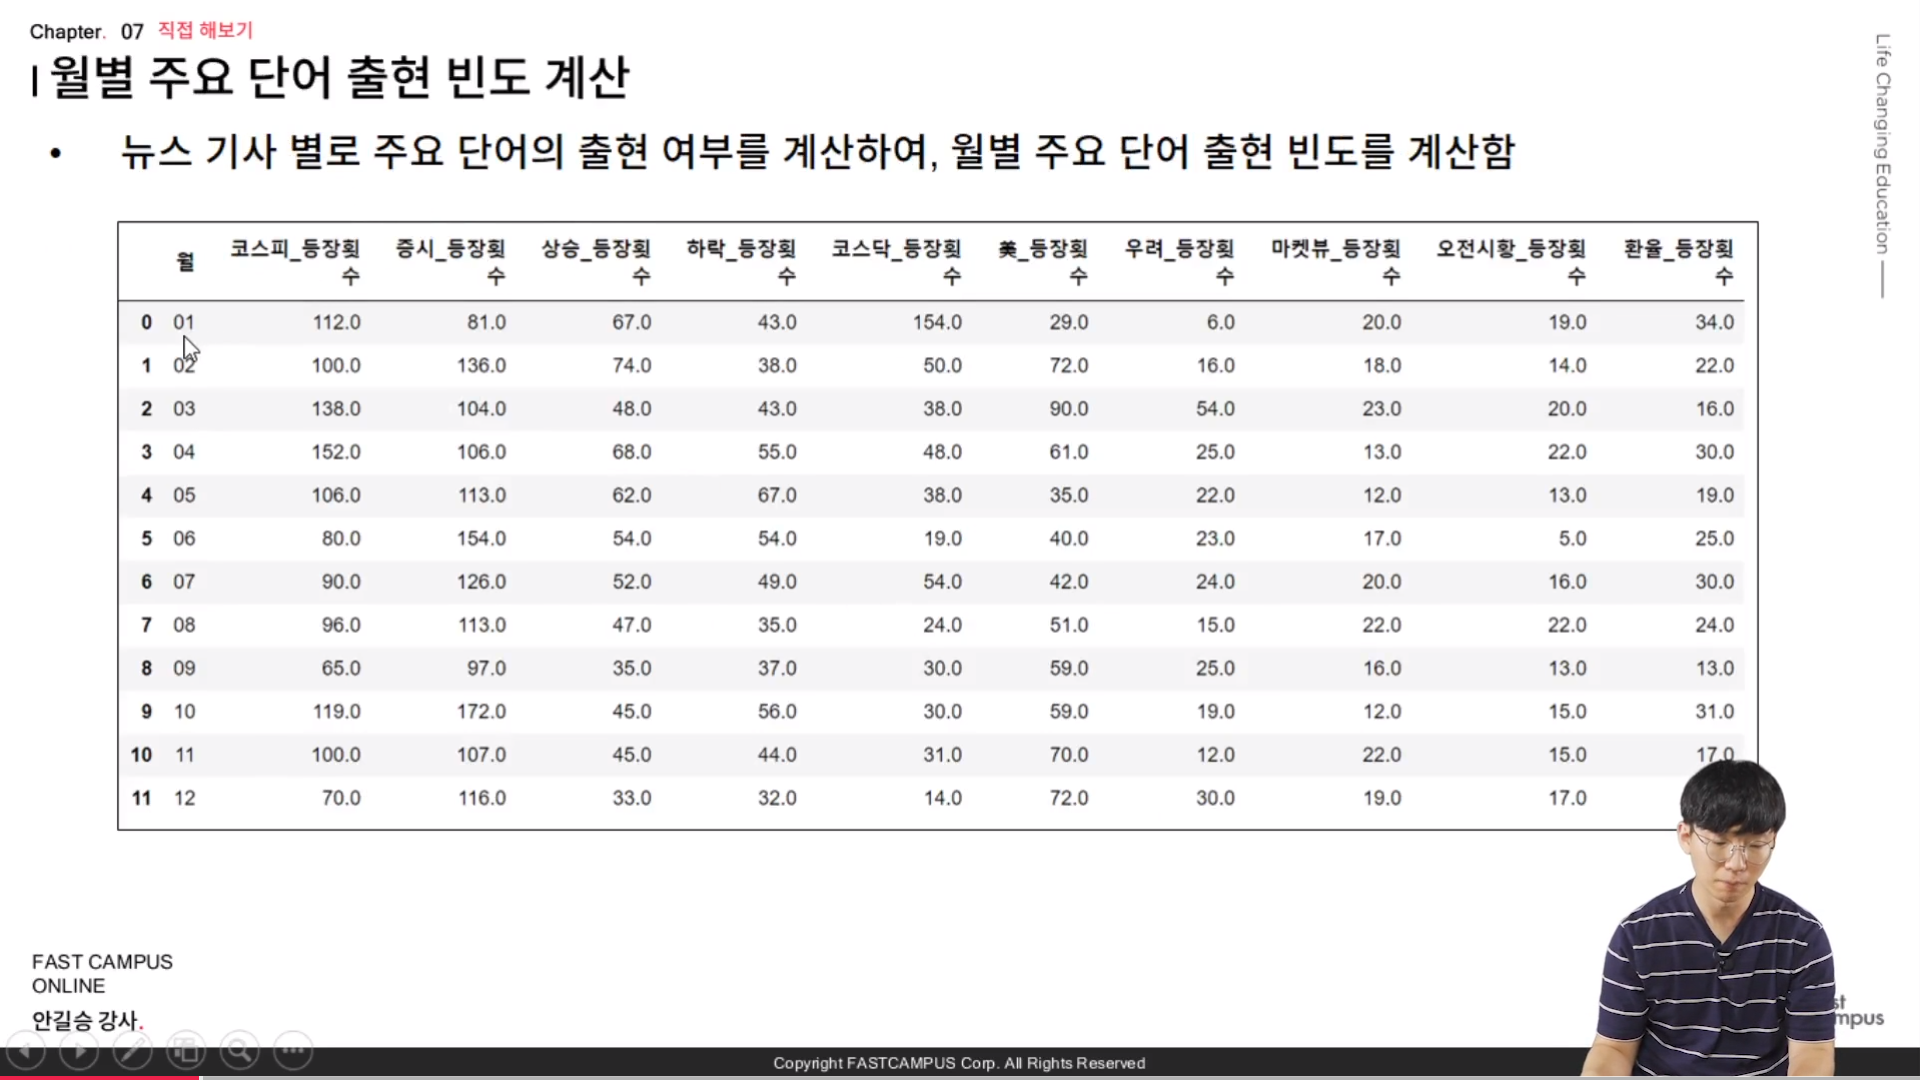
* 월별 주요 단어 출현 빈도 계산
* 실습

// 기사제목은 미리 정제를 해놓은 상태이다.

// 월 추출
// ylim 을 통해서 한눈에 잘 들어오는 데이터로 바꿔준다.
// 다시 말해서 간단한 테크닉 중에 하나가 최대값의 1.1 배 크게, 최소값의 0.9 배 작게 나타내면 한눈에 데이터가 들어오게 된다.

// 기사들을 사용하기 위해서는 공백을 없애고, list 형태로 나타낸다.
// value_counts( ) 를 이용해서 count 를 한다.
// 주요 단어를 제외한 단어들은 기타 단어 라는 새로운 형태에 저장을 한다.
* 월별 주요 단어 출현 빈도 시각화
// 기타를 제외한 단어의 출현 빈도를 시각화 해보는 것이다.
// 참고로, sklearn.countvectorizer 를 이용해서 만들수 있다. -> 단어-문서 행렬
// sklearn.feature_extraction.text.CountVectorizer
scikit-learn.org/stable/modules/generated/sklearn.feature_extraction.text.CountVectorizer.html
class sklearn.feature_extraction.text.CountVectorizer(*, input='content', encoding='utf-8', decode_error='strict', strip_accents=None, lowercase=True, preprocessor=None, tokenizer=None, stop_words=None, token_pattern='(?u)\b\w\w+\b', ngram_range=(1, 1), analyzer='word', max_df=1.0, min_df=1, max_features=None, vocabulary=None, binary=False, dtype=<class 'numpy.int64'>)Convert a collection of text documents to a matrix of token counts
This implementation produces a sparse representation of the counts using scipy.sparse.csr_matrix.
If you do not provide an a-priori dictionary and you do not use an analyzer that does some kind of feature selection then the number of features will be equal to the vocabulary size found by analyzing the data.
Read more in the User Guide.
Parameters
inputstring {‘filename’, ‘file’, ‘content’}, default=’content’
If ‘filename’, the sequence passed as an argument to fit is expected to be a list of filenames that need reading to fetch the raw content to analyze.
If ‘file’, the sequence items must have a ‘read’ method (file-like object) that is called to fetch the bytes in memory.
Otherwise the input is expected to be a sequence of items that can be of type string or byte.
encodingstring, default=’utf-8’
If bytes or files are given to analyze, this encoding is used to decode.
decode_error{‘strict’, ‘ignore’, ‘replace’}, default=’strict’
Instruction on what to do if a byte sequence is given to analyze that contains characters not of the given encoding. By default, it is ‘strict’, meaning that a UnicodeDecodeError will be raised. Other values are ‘ignore’ and ‘replace’.
strip_accents{‘ascii’, ‘unicode’}, default=None
Remove accents and perform other character normalization during the preprocessing step. ‘ascii’ is a fast method that only works on characters that have an direct ASCII mapping. ‘unicode’ is a slightly slower method that works on any characters. None (default) does nothing.
Both ‘ascii’ and ‘unicode’ use NFKD normalization from unicodedata.normalize.
lowercasebool, default=True
Convert all characters to lowercase before tokenizing.
preprocessorcallable, default=None
Override the preprocessing (string transformation) stage while preserving the tokenizing and n-grams generation steps. Only applies if analyzer is not callable.
tokenizercallable, default=None
Override the string tokenization step while preserving the preprocessing and n-grams generation steps. Only applies if analyzer == 'word'.
stop_wordsstring {‘english’}, list, default=None
If ‘english’, a built-in stop word list for English is used. There are several known issues with ‘english’ and you should consider an alternative (see Using stop words).
If a list, that list is assumed to contain stop words, all of which will be removed from the resulting tokens. Only applies if analyzer == 'word'.
If None, no stop words will be used. max_df can be set to a value in the range [0.7, 1.0) to automatically detect and filter stop words based on intra corpus document frequency of terms.
token_patternstring
Regular expression denoting what constitutes a “token”, only used if analyzer == 'word'. The default regexp select tokens of 2 or more alphanumeric characters (punctuation is completely ignored and always treated as a token separator).
ngram_rangetuple (min_n, max_n), default=(1, 1)
The lower and upper boundary of the range of n-values for different word n-grams or char n-grams to be extracted. All values of n such such that min_n <= n <= max_n will be used. For example an ngram_range of (1, 1) means only unigrams, (1, 2) means unigrams and bigrams, and (2, 2) means only bigrams. Only applies if analyzer is not callable.
analyzerstring, {‘word’, ‘char’, ‘char_wb’} or callable, default=’word’
Whether the feature should be made of word n-gram or character n-grams. Option ‘char_wb’ creates character n-grams only from text inside word boundaries; n-grams at the edges of words are padded with space.
If a callable is passed it is used to extract the sequence of features out of the raw, unprocessed input.
Changed in version 0.21.
Since v0.21, if input is filename or file, the data is first read from the file and then passed to the given callable analyzer.
max_dffloat in range [0.0, 1.0] or int, default=1.0
When building the vocabulary ignore terms that have a document frequency strictly higher than the given threshold (corpus-specific stop words). If float, the parameter represents a proportion of documents, integer absolute counts. This parameter is ignored if vocabulary is not None.
min_dffloat in range [0.0, 1.0] or int, default=1
When building the vocabulary ignore terms that have a document frequency strictly lower than the given threshold. This value is also called cut-off in the literature. If float, the parameter represents a proportion of documents, integer absolute counts. This parameter is ignored if vocabulary is not None.
max_featuresint, default=None
If not None, build a vocabulary that only consider the top max_features ordered by term frequency across the corpus.
This parameter is ignored if vocabulary is not None.
vocabularyMapping or iterable, default=None
Either a Mapping (e.g., a dict) where keys are terms and values are indices in the feature matrix, or an iterable over terms. If not given, a vocabulary is determined from the input documents. Indices in the mapping should not be repeated and should not have any gap between 0 and the largest index.
binarybool, default=False
If True, all non zero counts are set to 1. This is useful for discrete probabilistic models that model binary events rather than integer counts.
dtypetype, default=np.int64
Type of the matrix returned by fit_transform() or transform().
Attributes
vocabulary_dict
A mapping of terms to feature indices.
fixed_vocabulary_: boolean
True if a fixed vocabulary of term to indices mapping is provided by the user
stop_words_set
Terms that were ignored because they either:
occurred in too many documents (max_df)
occurred in too few documents (min_df)
were cut off by feature selection (max_features).
This is only available if no vocabulary was given.
from sklearn.feature_extraction.text import CountVectorizer
>>> corpus = [
...     'This is the first document.',
...     'This document is the second document.',
...     'And this is the third one.',
...     'Is this the first document?',
... ]
>>> vectorizer = CountVectorizer()
>>> X = vectorizer.fit_transform(corpus)
>>> print(vectorizer.get_feature_names())
['and', 'document', 'first', 'is', 'one', 'second', 'the', 'third', 'this']
>>> print(X.toarray())
[[0 1 1 1 0 0 1 0 1]
 [0 2 0 1 0 1 1 0 1]
 [1 0 0 1 1 0 1 1 1]
 [0 1 1 1 0 0 1 0 1]]
>>> vectorizer2 = CountVectorizer(analyzer='word', ngram_range=(2, 2))
>>> X2 = vectorizer2.fit_transform(corpus)
>>> print(vectorizer2.get_feature_names())
['and this', 'document is', 'first document', 'is the', 'is this',
'second document', 'the first', 'the second', 'the third', 'third one',
 'this document', 'this is', 'this the']
 >>> print(X2.toarray())
 [[0 0 1 1 0 0 1 0 0 0 0 1 0]
 [0 1 0 1 0 1 0 1 0 0 1 0 0]
 [1 0 0 1 0 0 0 0 1 1 0 1 0]
[0 0 1 0 1 0 1 0 0 0 0 0 1]][02. Part 2) 탐색적 데이터 분석 Chapter 08. 시작에 앞서 탐색적 - 데이터 분석이란 - 01. 정의 및 중요성]

* 정의
- 탐색적 데이터 분석 (Exploratory Data Analysis; EDA) 란 그래프를 통한 시각화와 통계 분석 등을 바탕으로 수집한 데이터를 다양한 각도에서 관찰하고 이해하는 방법
// insight 를 얻기 위해서 다양한 시각에서도 분석을 하는 것이다.
* 필요성 및 효과
- 데이터를 여러 각도에서 살펴보면서 데이터의 전체적인 양상과 보이지 않던 현상을 더 잘 이해할 수 있도록 도와준다.
- 문제 정의 단계에서 발견하지 못한 패턴을 발견하고, 이를 바탕으로 데이터 전처리 및 모델에 관한 가설을 추가하거나 수정할 수 있다.
- 즉, 본격적인 데이터 분석에 앞서 구체적인 분석 계획을 수립하는데 도움이 된다.
// EDA 를 잘만 활용한다면 가설을 통해서 insight 얻기 위한 중요하다.
* 가설 수립과 검정하기
- 탐색적 데이터 분석은 가설 (질문) 수립과 검정의 반복으로 구성된다.

// 가설검증이라는 것은 통계적인 방법을 활용한다는 의미도 있지만, 단순히 그 데이터를 가지고도 확인을 할 수 있다.
* 가설 수립과 검정하기 (예시)
- 문제 상황 : 한 보험사에서 고객의 이탈이 크게 늘고 있어, 이탈할 고객들을 미리 식별하는 모델을 만들고, 이탈할 것이라 예상되는 고객을 관리하여 이탈율을 줄이고자 한다.
- 가장 먼저 선행되어야 하는 작업은 고객의 이탈 원인을 파악하는 것이고, 파악된 원인을 모델의 특징으로 사용해야 한다.

// 이탈을 막는것도 중요하지만 원인을 파악하는 것이 더 중요하다.
// 보험회사의 단순한 domain 을 이용해서 사용한 것이다.
// 이 가설들로만 추상적이기 때문에 검정 방법을 좀 더 디테일하게 추가하여 시작하는 것이다.
* 주요 활동

// 분석 목적 및 변수 확인 을 지루한 작업이기 때문에 사람들이 많이 누락하는데.. 이 작업을 해야지만 단순한 이쁜 시각화된 데이터가 아니라 정확히 원하는 데이터를 얻을 수 있다.
// 변수간 확인 작업 중요하다!!!
[02. Part 2) 탐색적 데이터 분석 Chapter 08. 시작에 앞서 탐색적 - 데이터 분석이란 - 02. 사례 소개]

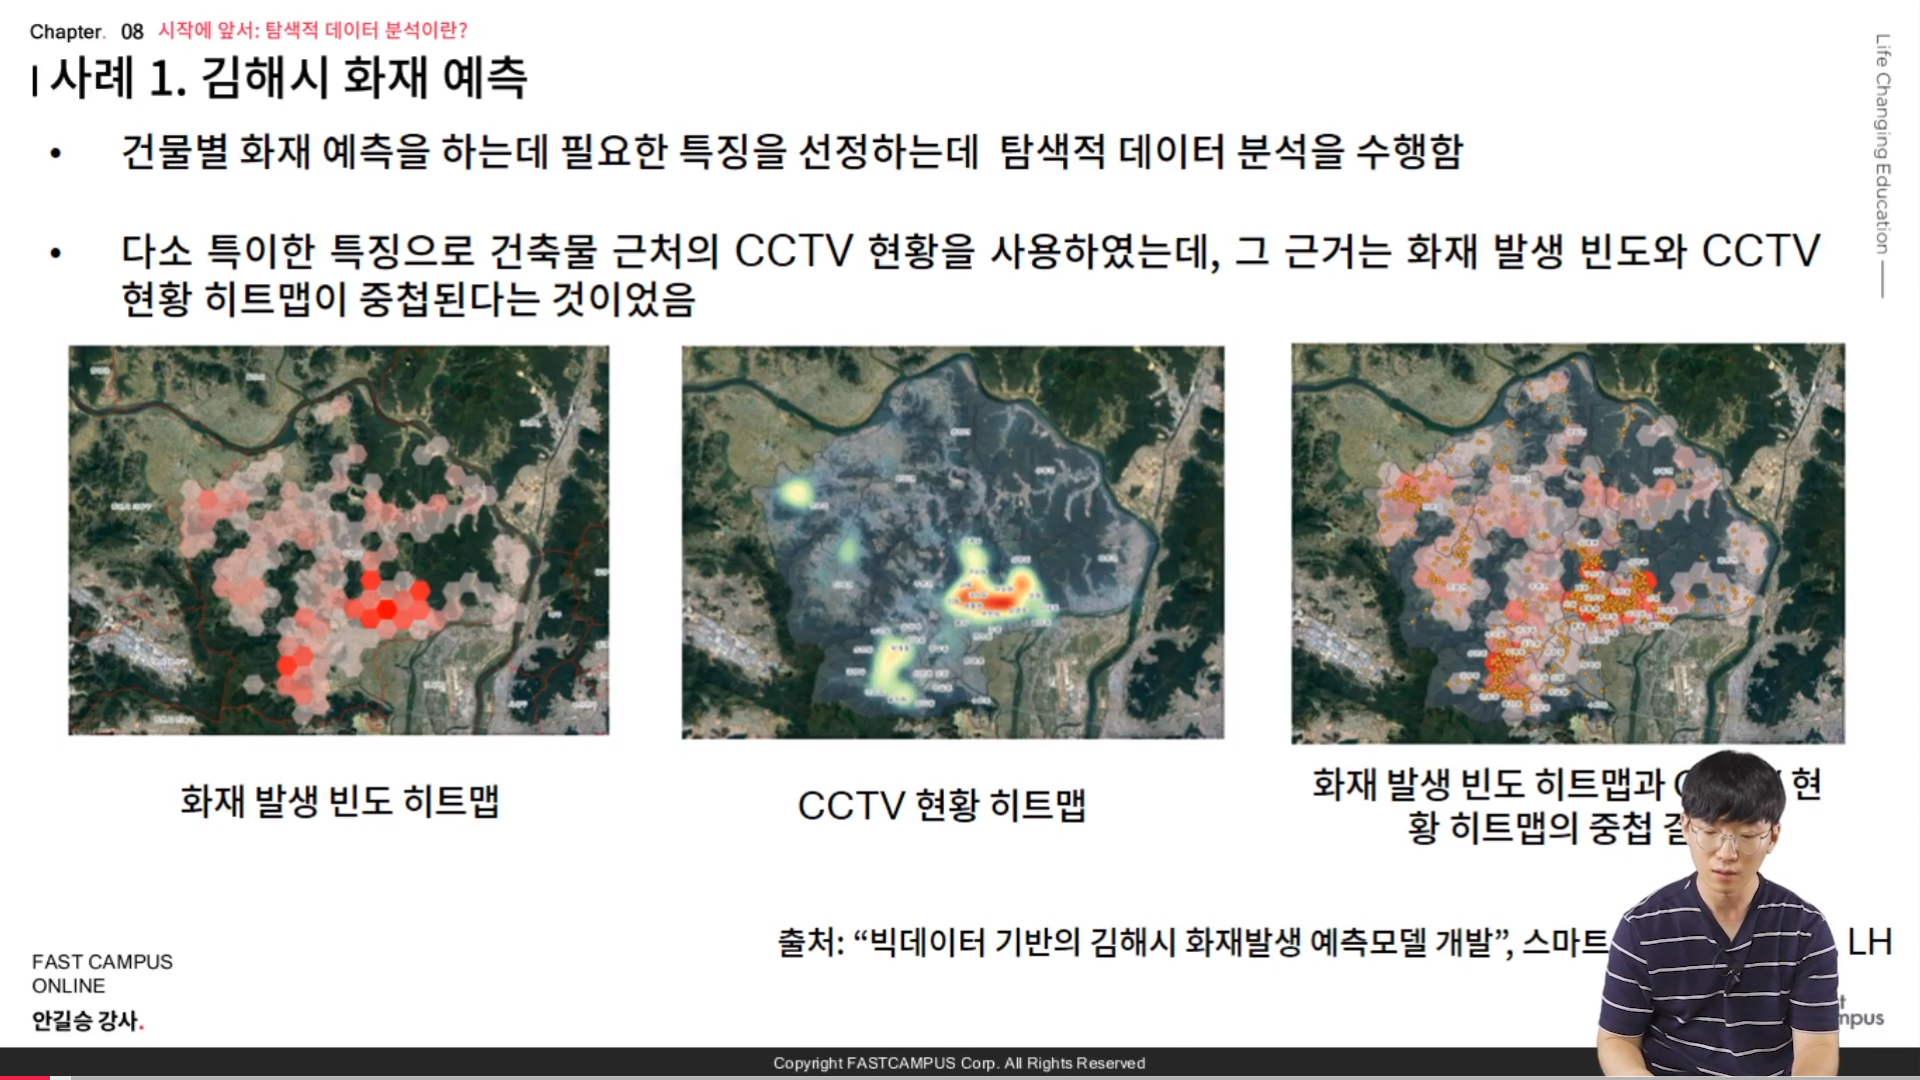
* 사례 1. 김해시 화재 예측
- 건물별 화재 예측을 하는데 필요한 특징을 선정하는데 탐색적 데이터 분석을 수행한다.
- 다소 특이한 특징으로 건축물 근처의 CCTV 현황을 사용하였는데, 그 그건거는 화재 발생 빈도와 CCTV 현황 히트맵이 중첩된다는 것이었다.

// 머신러닝에서 특징이는 예측에 쓰이는 변수들을 특징이라고 부른다.
// 건축물 근처에 CCTV 와 관계가 있을까? 동향지식이 있다면 좀 더 이해가 가능하겠지만.. 이건 탐색적 데이터 분석에 대한 결과이다.
// 화재 발생빈도와 CCTV 현황이 중첩이 되는 것을 확인하고 그 데이터를 이용해서 분석 하는 것이 바람직하겠구나라고 우선 생각한다.
// 반대로 중첩이 된다면 동시에 볼 필요도 없겠구나..라고도 생각할 수 도 있다.
* 사례 2. 밸브의 불량이 발생하는 공정상의 원인 파악
- 밸브의 생산 공정에서 발생하는 불량이 발생하는 원인을 파악하기 위해, 탐색적 데이터 분석을 수행한다.

// y 축에는 제품 스펙(variable), x 축 공정 환경 변수
// 상관분석을 통해서 어느 정도 방향을 잡을 수 있다.
// 의사결정나무 분석을 이용해서 특정 조건에서 만족하는지를 나타내는 것이다.
// 불량을 줄이는 것... -> 처방적 분석
* 사례 3. 설비 문제 알람의 원인 탐색
- 설비의 문제 알람이 발생하는 원인을 탐색하고, 설비 데이터 자체에 문제를 파악하기 위해 EDA 를 적용한다.
- 분석 내용 : 설비 데이터에 비정상적으로 수집되는 사례가 다수 있음을 확인할 수 있다.
- 결론 : 비정상적으로 수집된 데이터가 다수 있어, 원할하게 2차년도를 진행하기 위해서 재수집이 필요하다.

// 설비가 있다면 여러가지 알람이 있다. ex) 툴을 간다던가, 문이 열려 있다던가, 작업자 등에 의한 알람등
// 중요한 작업이지만, 노가다성 작업이 굉장히 많다.
// 이런 데이터를 사용해서 다양한 추론을 해 볼수가 있다는 것이다.
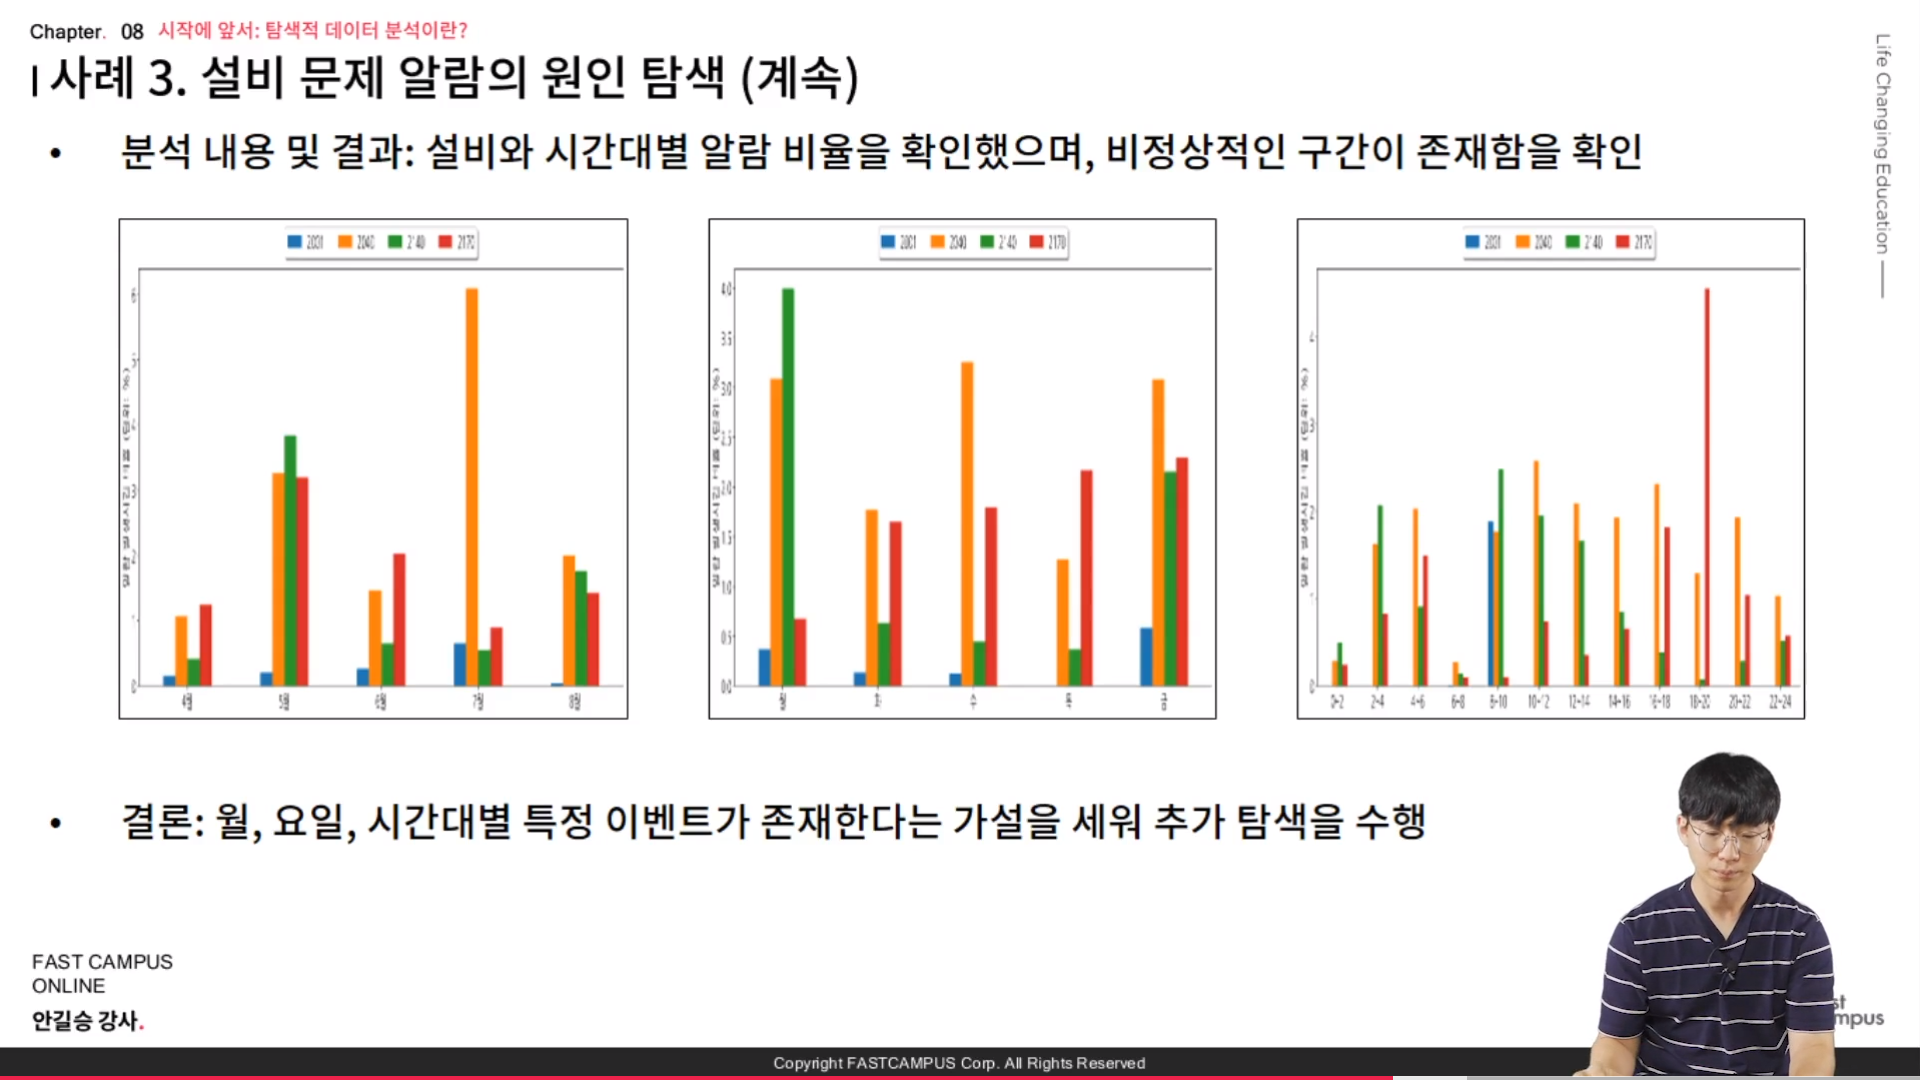
- 분석 내용 및 결과 : 설비와 시간대별 알람 비율을 확인했으며, 비정상적인 구간이 존재함을 확인
- 결론: 월, 요일, 시간대별 특정 이벤트가 존재하다는 가설을 세워 추가 탐색을 수행한다.

// 문제가 많아서 좀 더 시간대별 데이터로 분석을 해보고, 이걸 바탕으로 특정 시간대의 데이터를 더 많이 얻어야겠다는 가설을 세울수 있다.
- 분석 내용 : 알람 간 동시 발생 여부 및 알람 간 선행 여부 분석
- 결론 : 동시 발생하는 알람과 선행 및 후행하는 알람 간 관계를 파악하여, 알람들을 카테고리화한다.

// 상기 두 데이터는 수학적인 테크닉이 존재하지는 않는다. 강의에서 배우는 것을 사용할 수 없다는 것이다. 이건 특별한 경우를 통해서 나온 데이터라는 것이다.
[파이썬을 활용한 데이터 전처리 Level UP-Comment]
- 뉴스 키워드를 모아서 주요 빈도 등을 graph 를 통해서 insight 얻는 방법을 알아봤고, 탐색적 분석을 통해서 어떤게 마주한 문제들을 해결할 수 있을지에 대해서도 알아봤다.
파이썬을 활용한 데이터 전처리 Level UP 올인원 패키지 Online. | 패스트캠퍼스
데이터 분석에 필요한 기초 전처리부터, 데이터의 품질 및 머신러닝 성능 향상을 위한 고급 스킬까지 완전 정복하는 데이터 전처리 트레이닝 온라인 강의입니다.
www.fastcampus.co.kr
'Programming > Python' 카테고리의 다른 글
| [패스트캠퍼스 수강 후기] 데이터전처리 100% 환급 챌린지 12회차 미션 (0) | 2020.11.13 |
|---|---|
| [패스트캠퍼스 수강 후기] 데이터전처리 100% 환급 챌린지 11회차 미션 (0) | 2020.11.12 |
| [패스트캠퍼스 수강 후기] 데이터전처리 100% 환급 챌린지 9 회차 미션 (0) | 2020.11.10 |
| [패스트캠퍼스 수강 후기] 데이터전처리 100% 환급 챌린지 8 회차 미션 (0) | 2020.11.09 |
| [패스트캠퍼스 수강 후기] 데이터전처리 100% 환급 챌린지 7 회차 미션 (0) | 2020.11.08 |


